
Academic
Students Score for a period or the final grade, Subjects Comparison across years, Grading Summary, Custom Assessment, Find Subjects By Score, Archived Gradebook Scores from past years and Student Progress charts.
Reports
More than 60 built-in reports cover every area of the school, from grades and attendance to billing, admissions, the library and the clinic. Anything else, you build yourself in a few guided steps, with no code. Reports filter, sort, export and print, and each person sees only what their role allows.
Built-in Reports
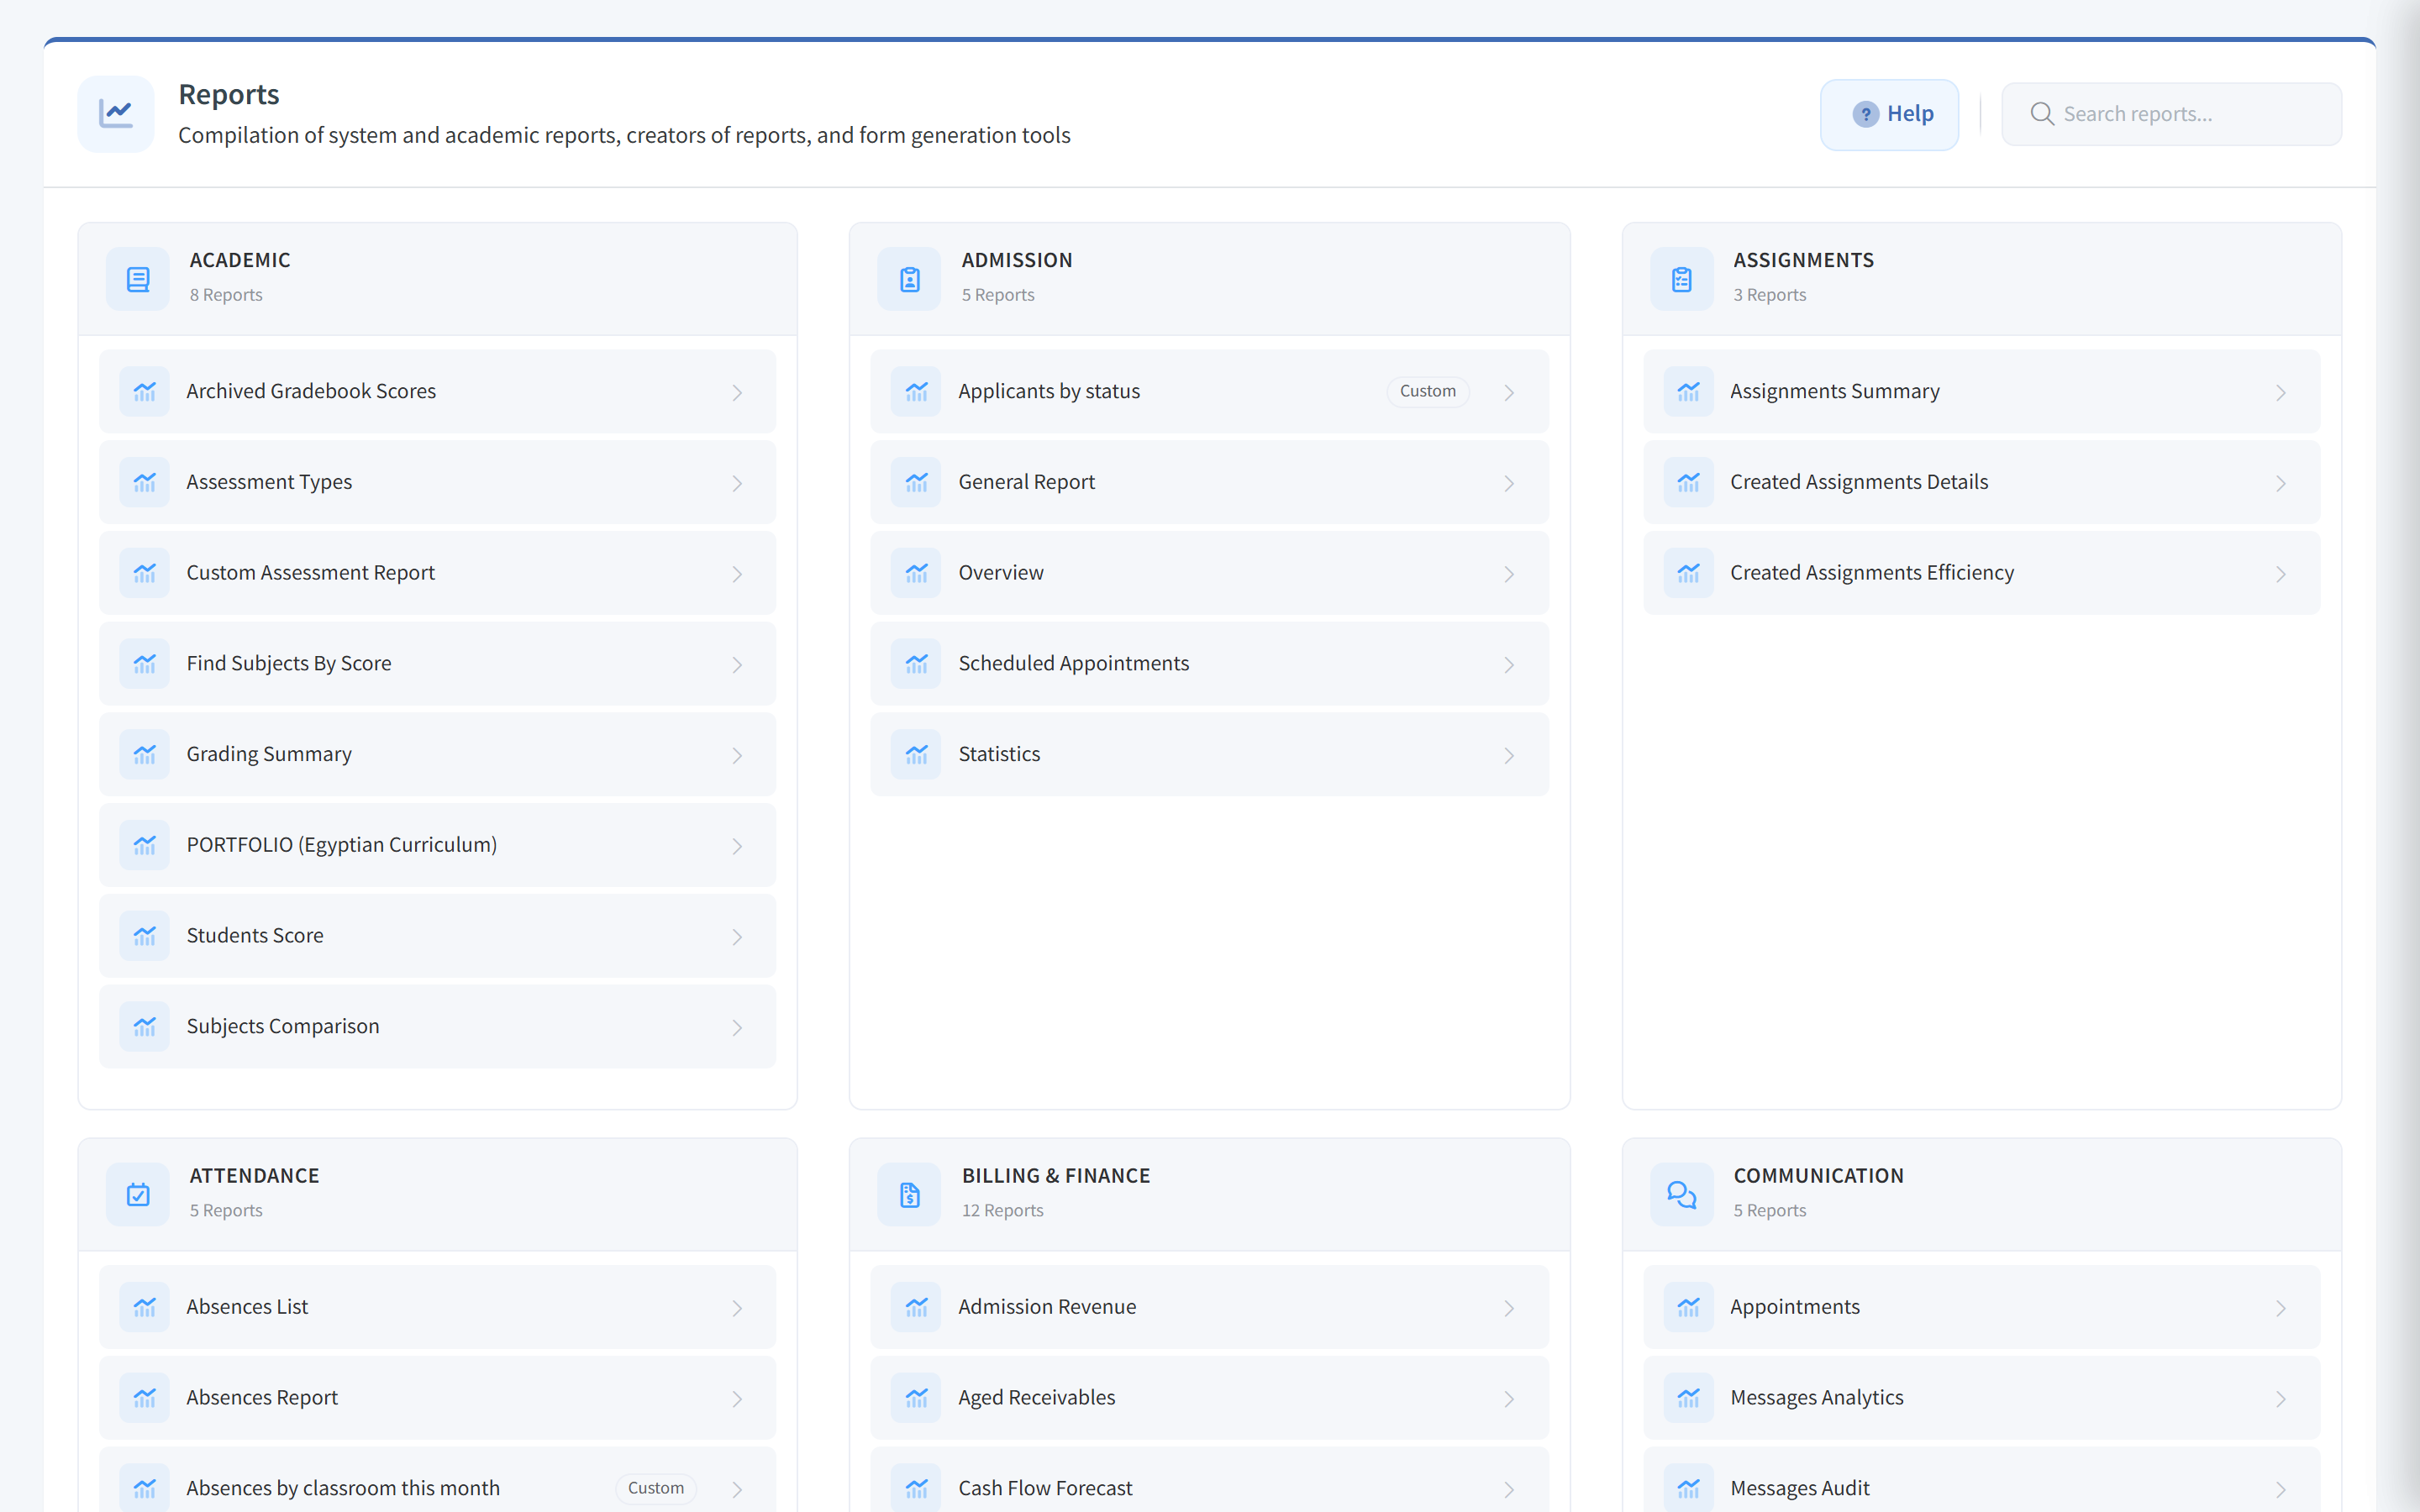
Open Reports and every report sits in a card for its area, with a search that narrows them as you type. A report added in a new SCL version is marked, so you spot it at once.
Students Score for a period or the final grade, Subjects Comparison across years, Grading Summary, Custom Assessment, Find Subjects By Score, Archived Gradebook Scores from past years and Student Progress charts.
Missing Gradebook Marks, Missing Assessment Types and Missing Skills Assessments before report cards close, homeroom registers not taken yet, the assignments each teacher created and the Heads of Department.
Absences per student over any dates by absence type, including the students with perfect attendance, the Absences List day by day, and Class Attendance for every lesson, lateness included.
Applicants in each admission phase by division and grade, with charts, every applicant with the columns you pick from the admission form, and each assessment, interview and payment appointment.
Aged Receivables, Cash Flow Forecast, Collection Summary with the collection rate, Family Statement, Fee Schedule Variance, Uninvoiced Students, Refunds and Cancellations, Reminder Effectiveness, Store Revenue, Admission Revenue and Suspension Exposure.
Enrollment Overview of promoted, new and transferred students in each grade, the Classes Report, Transfers Out with each student's new school and the reason, and the roster of every elective course.
Students Information and Parents Information with the columns you choose, Siblings Information to find families, and the students and families who still have no SCL account.
Messages Analytics, a read-only Messages Audit of teachers' conversations with parents and students, Unread Messages, parent meetings per teacher and Weekly Bulletin entries.
House Points and the race between houses, the Mood Report of how students say they feel, Clinic Visits with their reasons and outcomes, and Login Streaks.
Overdue books, the most borrowed titles, titles never borrowed, titles with every copy out and holds waiting, and copies lost or damaged.
Every bus route with its vehicle, seats and riders this year, and the students of each route on a card with the driver and the driver's mobile number.
The Email Log with opens, the SMS Log with each message's cost, the Users Access and Request Logs, and Private Storage use, down to the minutes students spent reading each PDF.
In Every Report
Choose the grades, the columns and the dates a report covers before it runs.
Click a heading to sort, or type in the box under it to narrow the rows.
Save to Excel, CSV or PDF, or print, with your sorting and searches applied.
Each person sees only the reports and the grades their group may open, so one report serves the principal and a head of department alike.
Every part of SCL writes to one record, so reports read it directly instead of last month's export.
Every administrator arranges their own dashboard of live charts and figures, and refreshes any of them without reloading the page.
Custom Reports
Custom Reports builds reports from your school's own data with nothing technical to learn. Choose what each row is, from students and families to invoices, clinic visits and bus riders, then pick the columns, filter, group and total, add a chart and share it. It runs on live data every time someone opens it.
How It Works
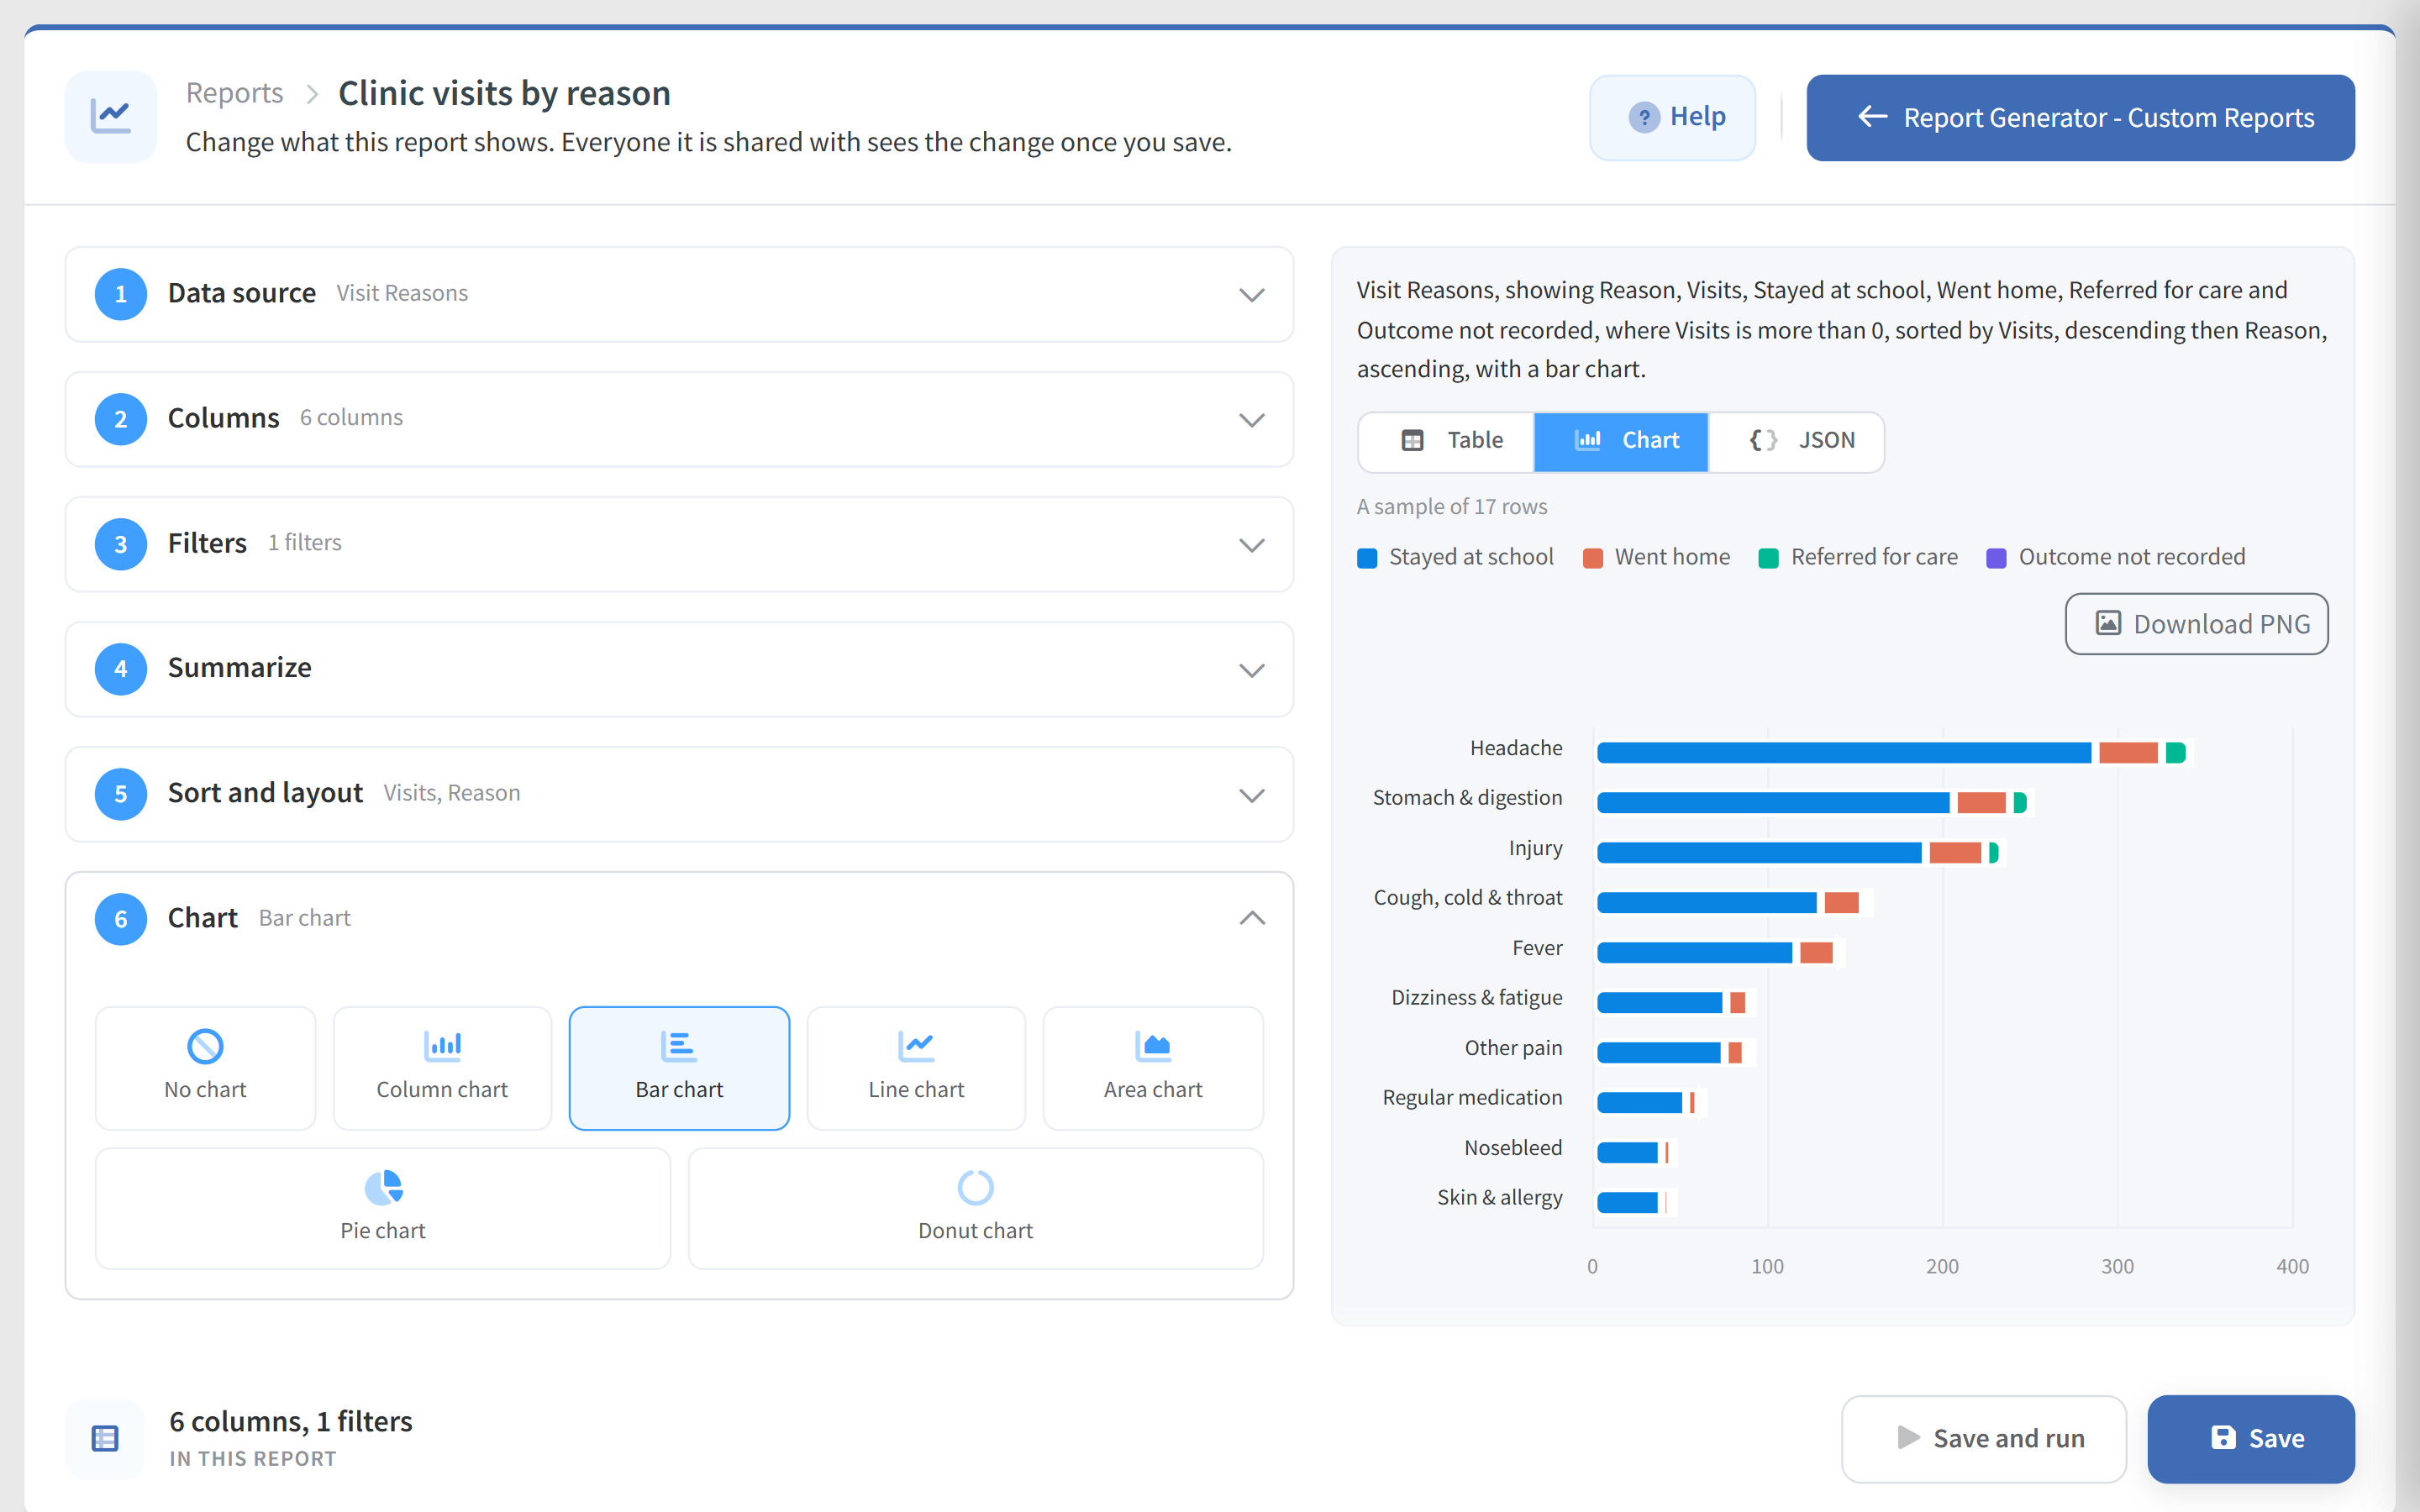
The builder walks you through it, with a live preview of the table and the chart beside every step.
Pick what each row of the report is: students, families, classrooms, absences, invoices, applicants, library loans, bus riders, clinic visits and more.
Add the fields you need, reach into related records such as a classroom's grade, and count connected ones, such as the girls in each class.
Keep the rows that match all or any of your conditions. Turn a filter into a question, and whoever runs the report chooses its value.
Turn one row per record into one row per group, with counts, totals and averages, and dates grouped by day, week, month, quarter or year.
Sort by up to five columns, add a totals row, choose portrait or landscape for the PDF, and draw a column, bar, line, area, pie or donut chart.
Give it a title in each language and a place on the Reports page, then share it with everyone with access, chosen groups or only you.
Run and Share
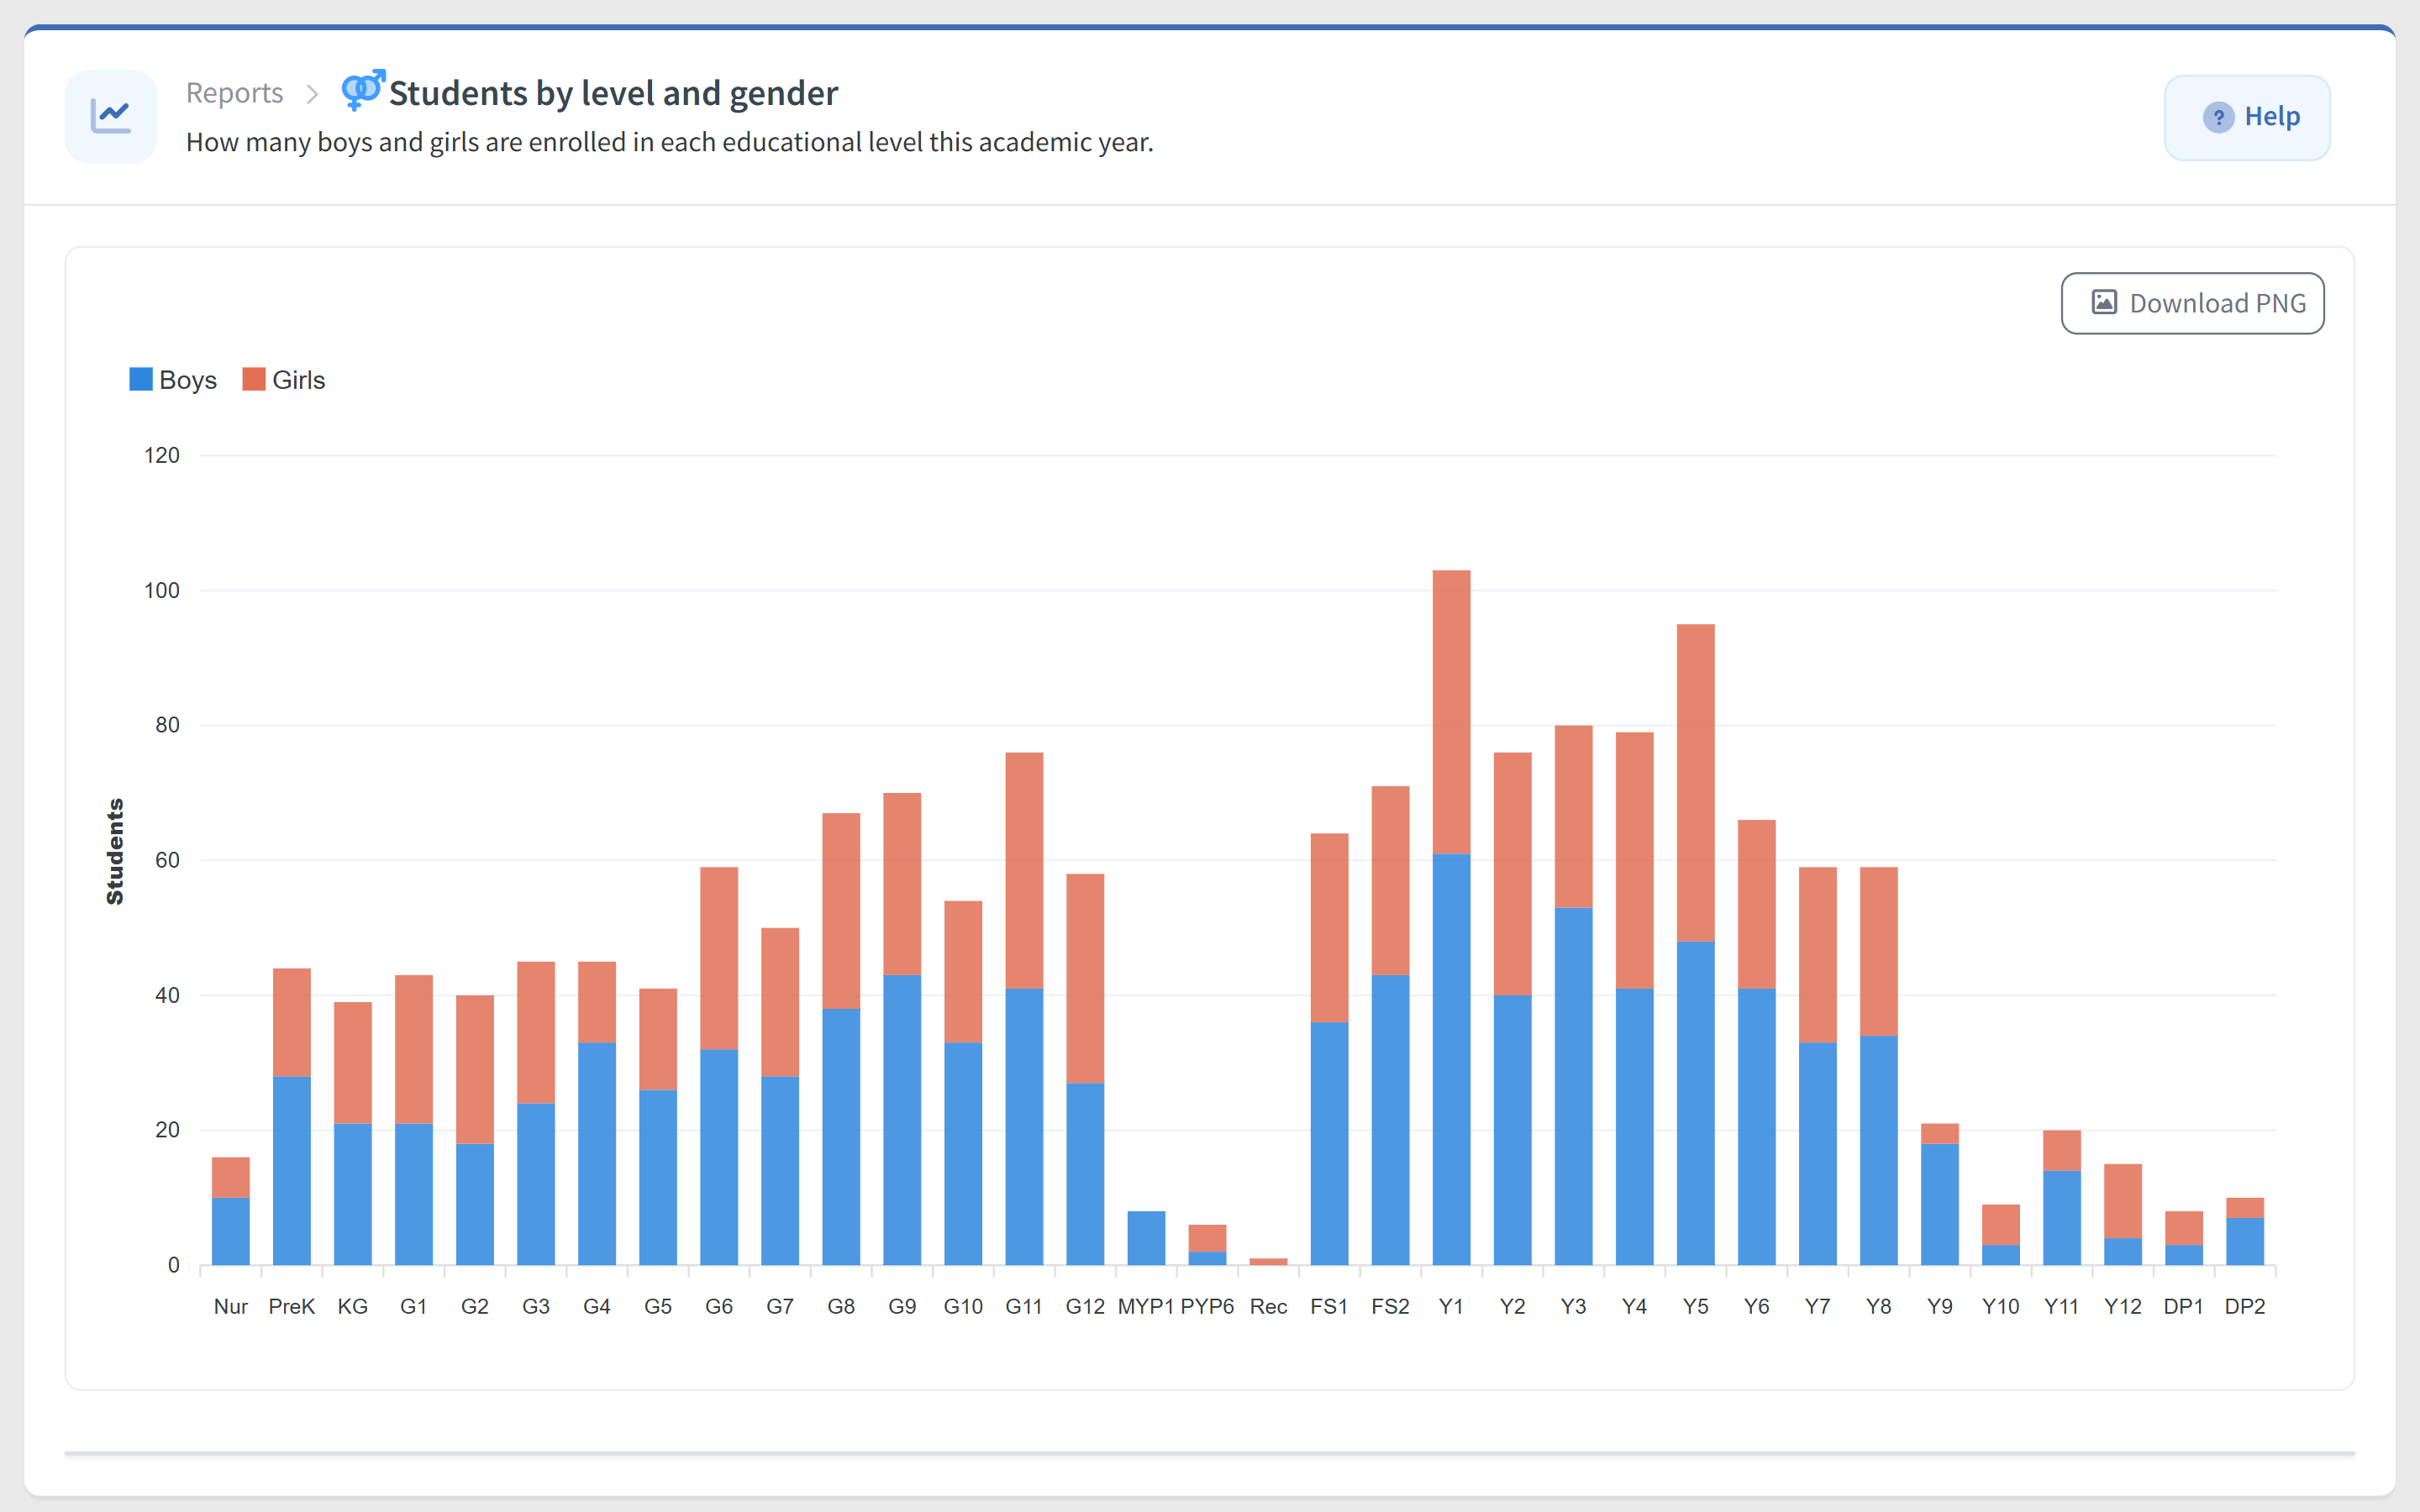
A custom report opens on its own page: the questions it asks, the chart, the table and the exports. The page's address keeps your choices, so you can bookmark a filtered run or send it to a colleague, who sees only what their own access allows.
Ready to Adapt
Install a ready-made report, such as Absences by classroom this month, Outstanding balances by classroom or Riders per route, and adapt it in the builder.
When SCL ships an improved starter, its card says an update is available, and SCL asks before replacing any change you made.
Download any report as a small file and import it at another school after a review. Grades and classrooms travel by name, and who may open it never travels.
Everyone with access, chosen groups or only you. Sharing decides who may open a report, never what data they see.
A report that reads personal or sensitive data is tagged in the library, says so on its page and records every run.
Each report remembers which pages of SCL it reads and checks them again every time it runs, so a colleague without access to one cannot run it.
AI Assistants
With SCL Connect, AI assistants such as Claude and ChatGPT work inside SCL as the person who signed in, never beyond their role.
Ask for absences per class this month, and the assistant builds the custom report, its columns, filters and chart included.
The assistant finds the right built-in or custom report, runs it with your filters and explains what it shows.
It acts as you and can never do more than your role allows, and every report still shows only the data you may see.
Subjects Comparison
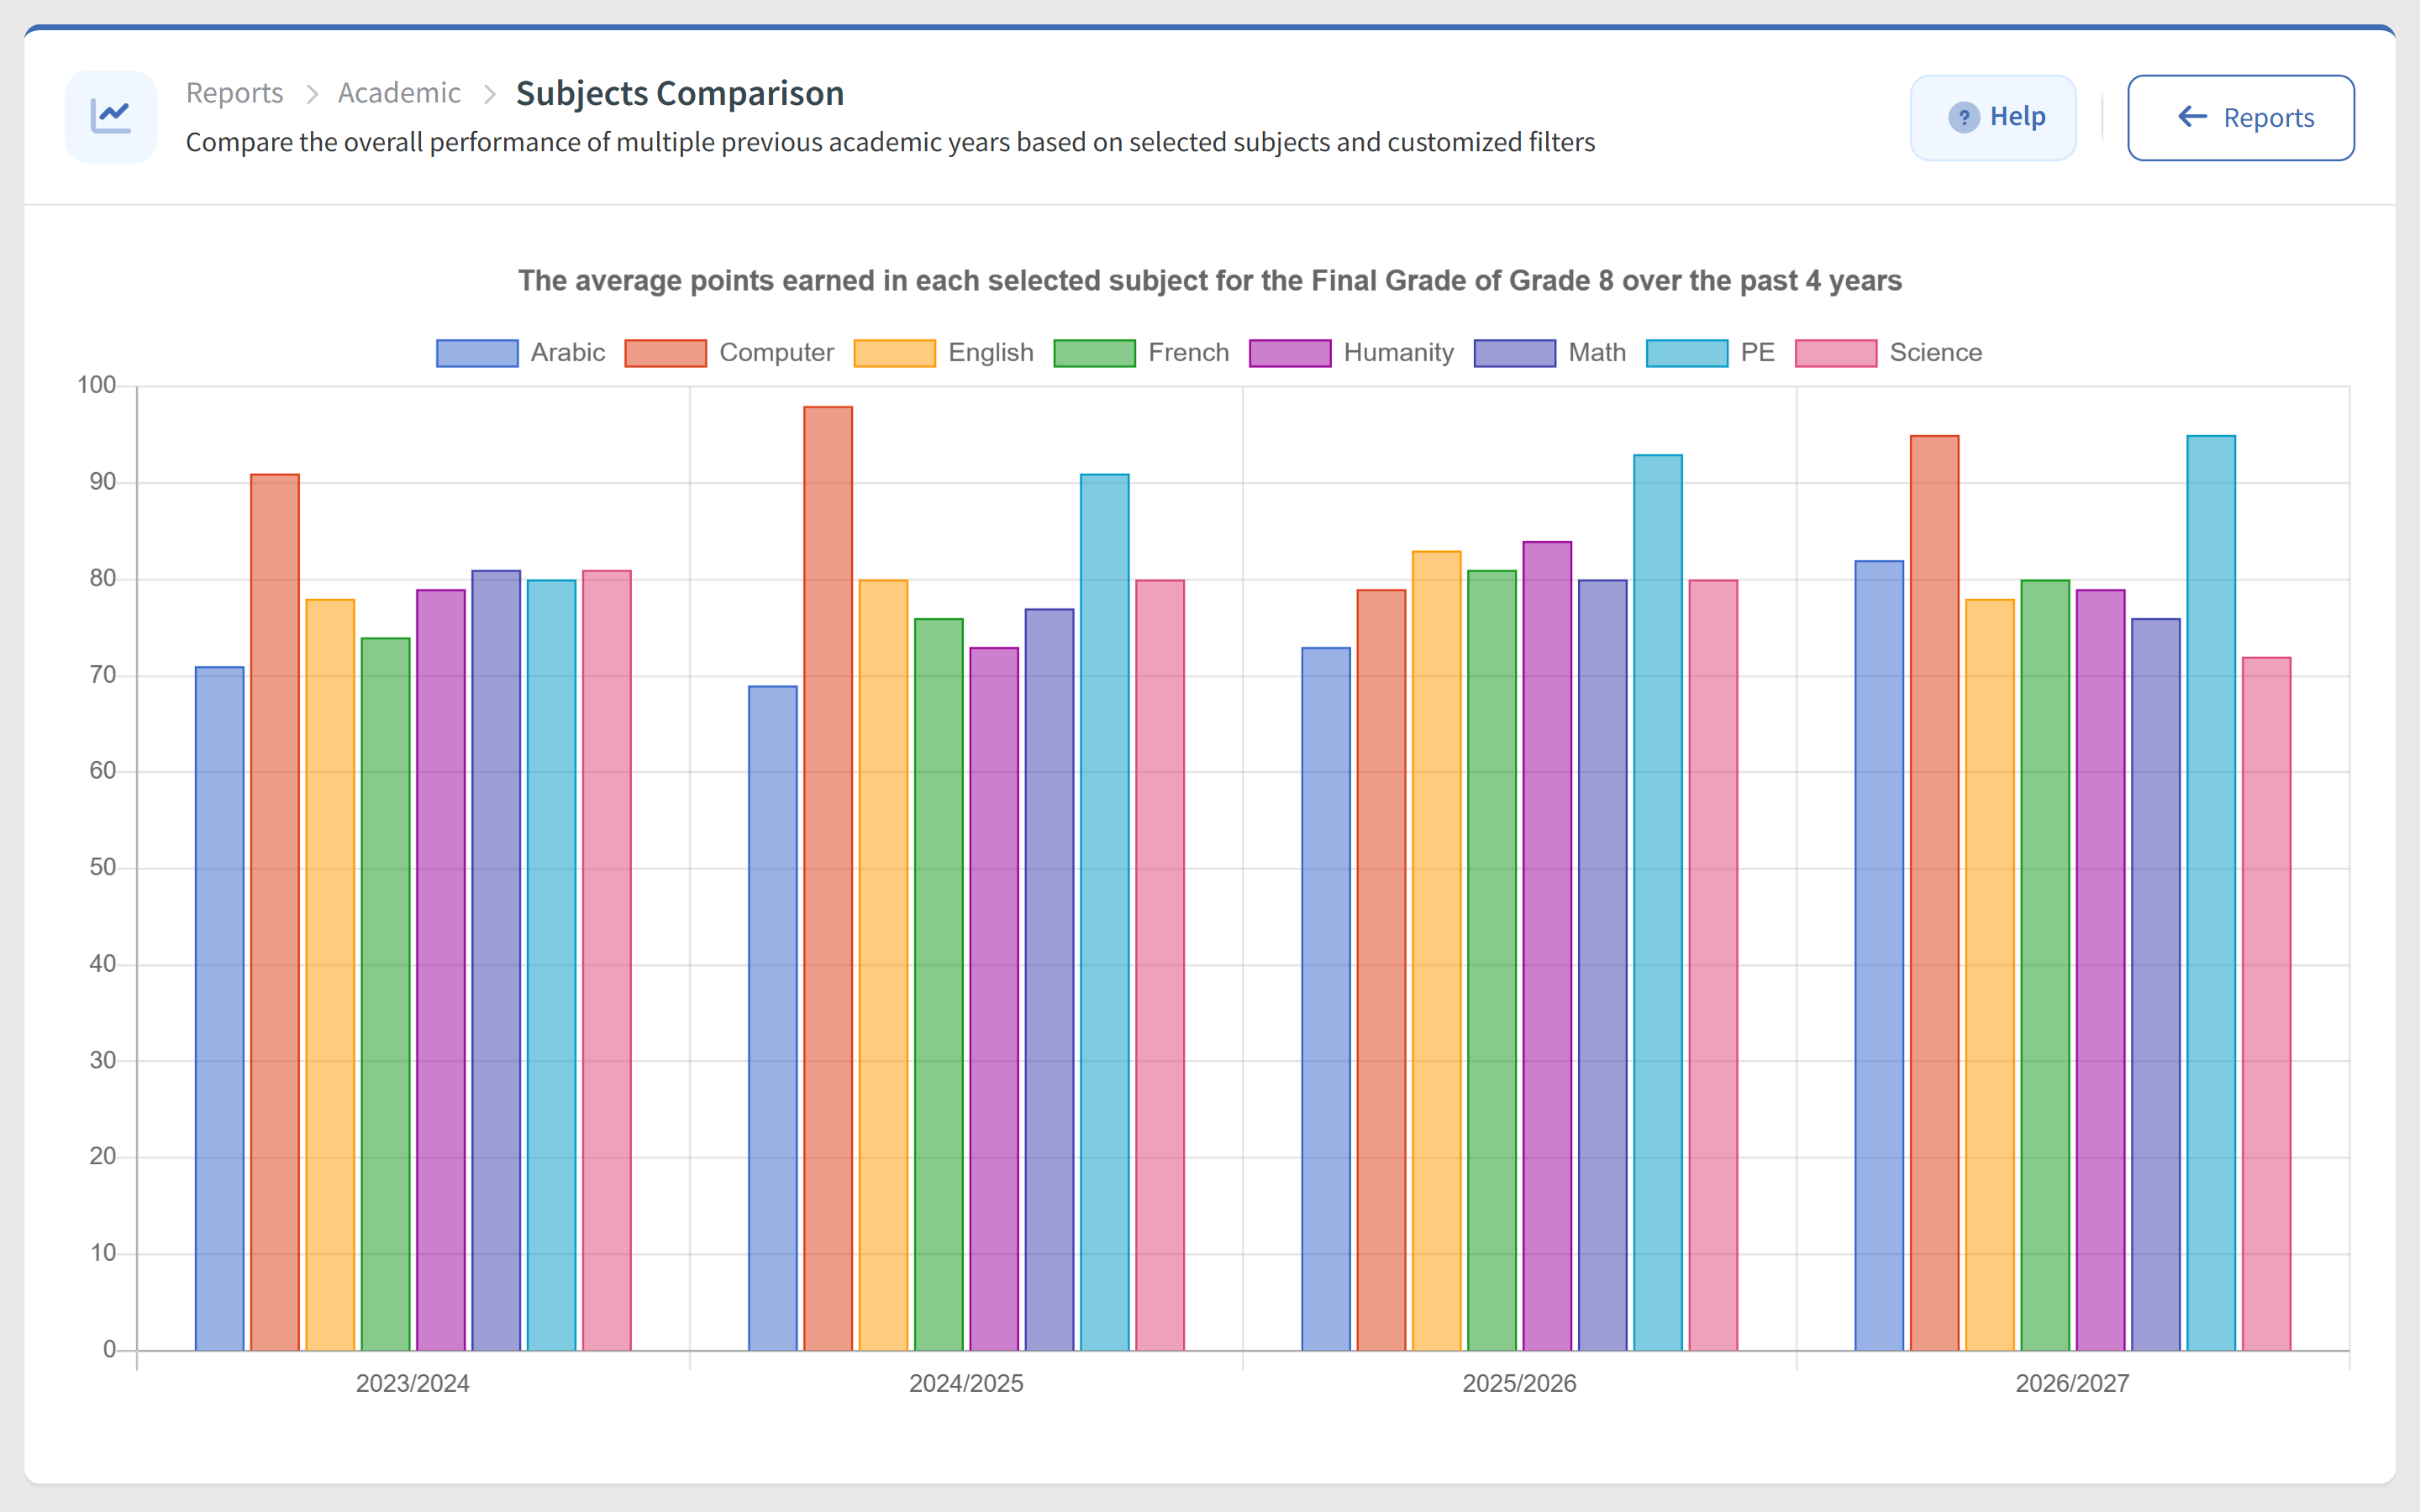
Subjects Comparison charts how a level performed in its subjects, as an average grade or a count of students, across this year and as many earlier years as you want beside it, with the numbers for each student underneath.
Automation Tasks
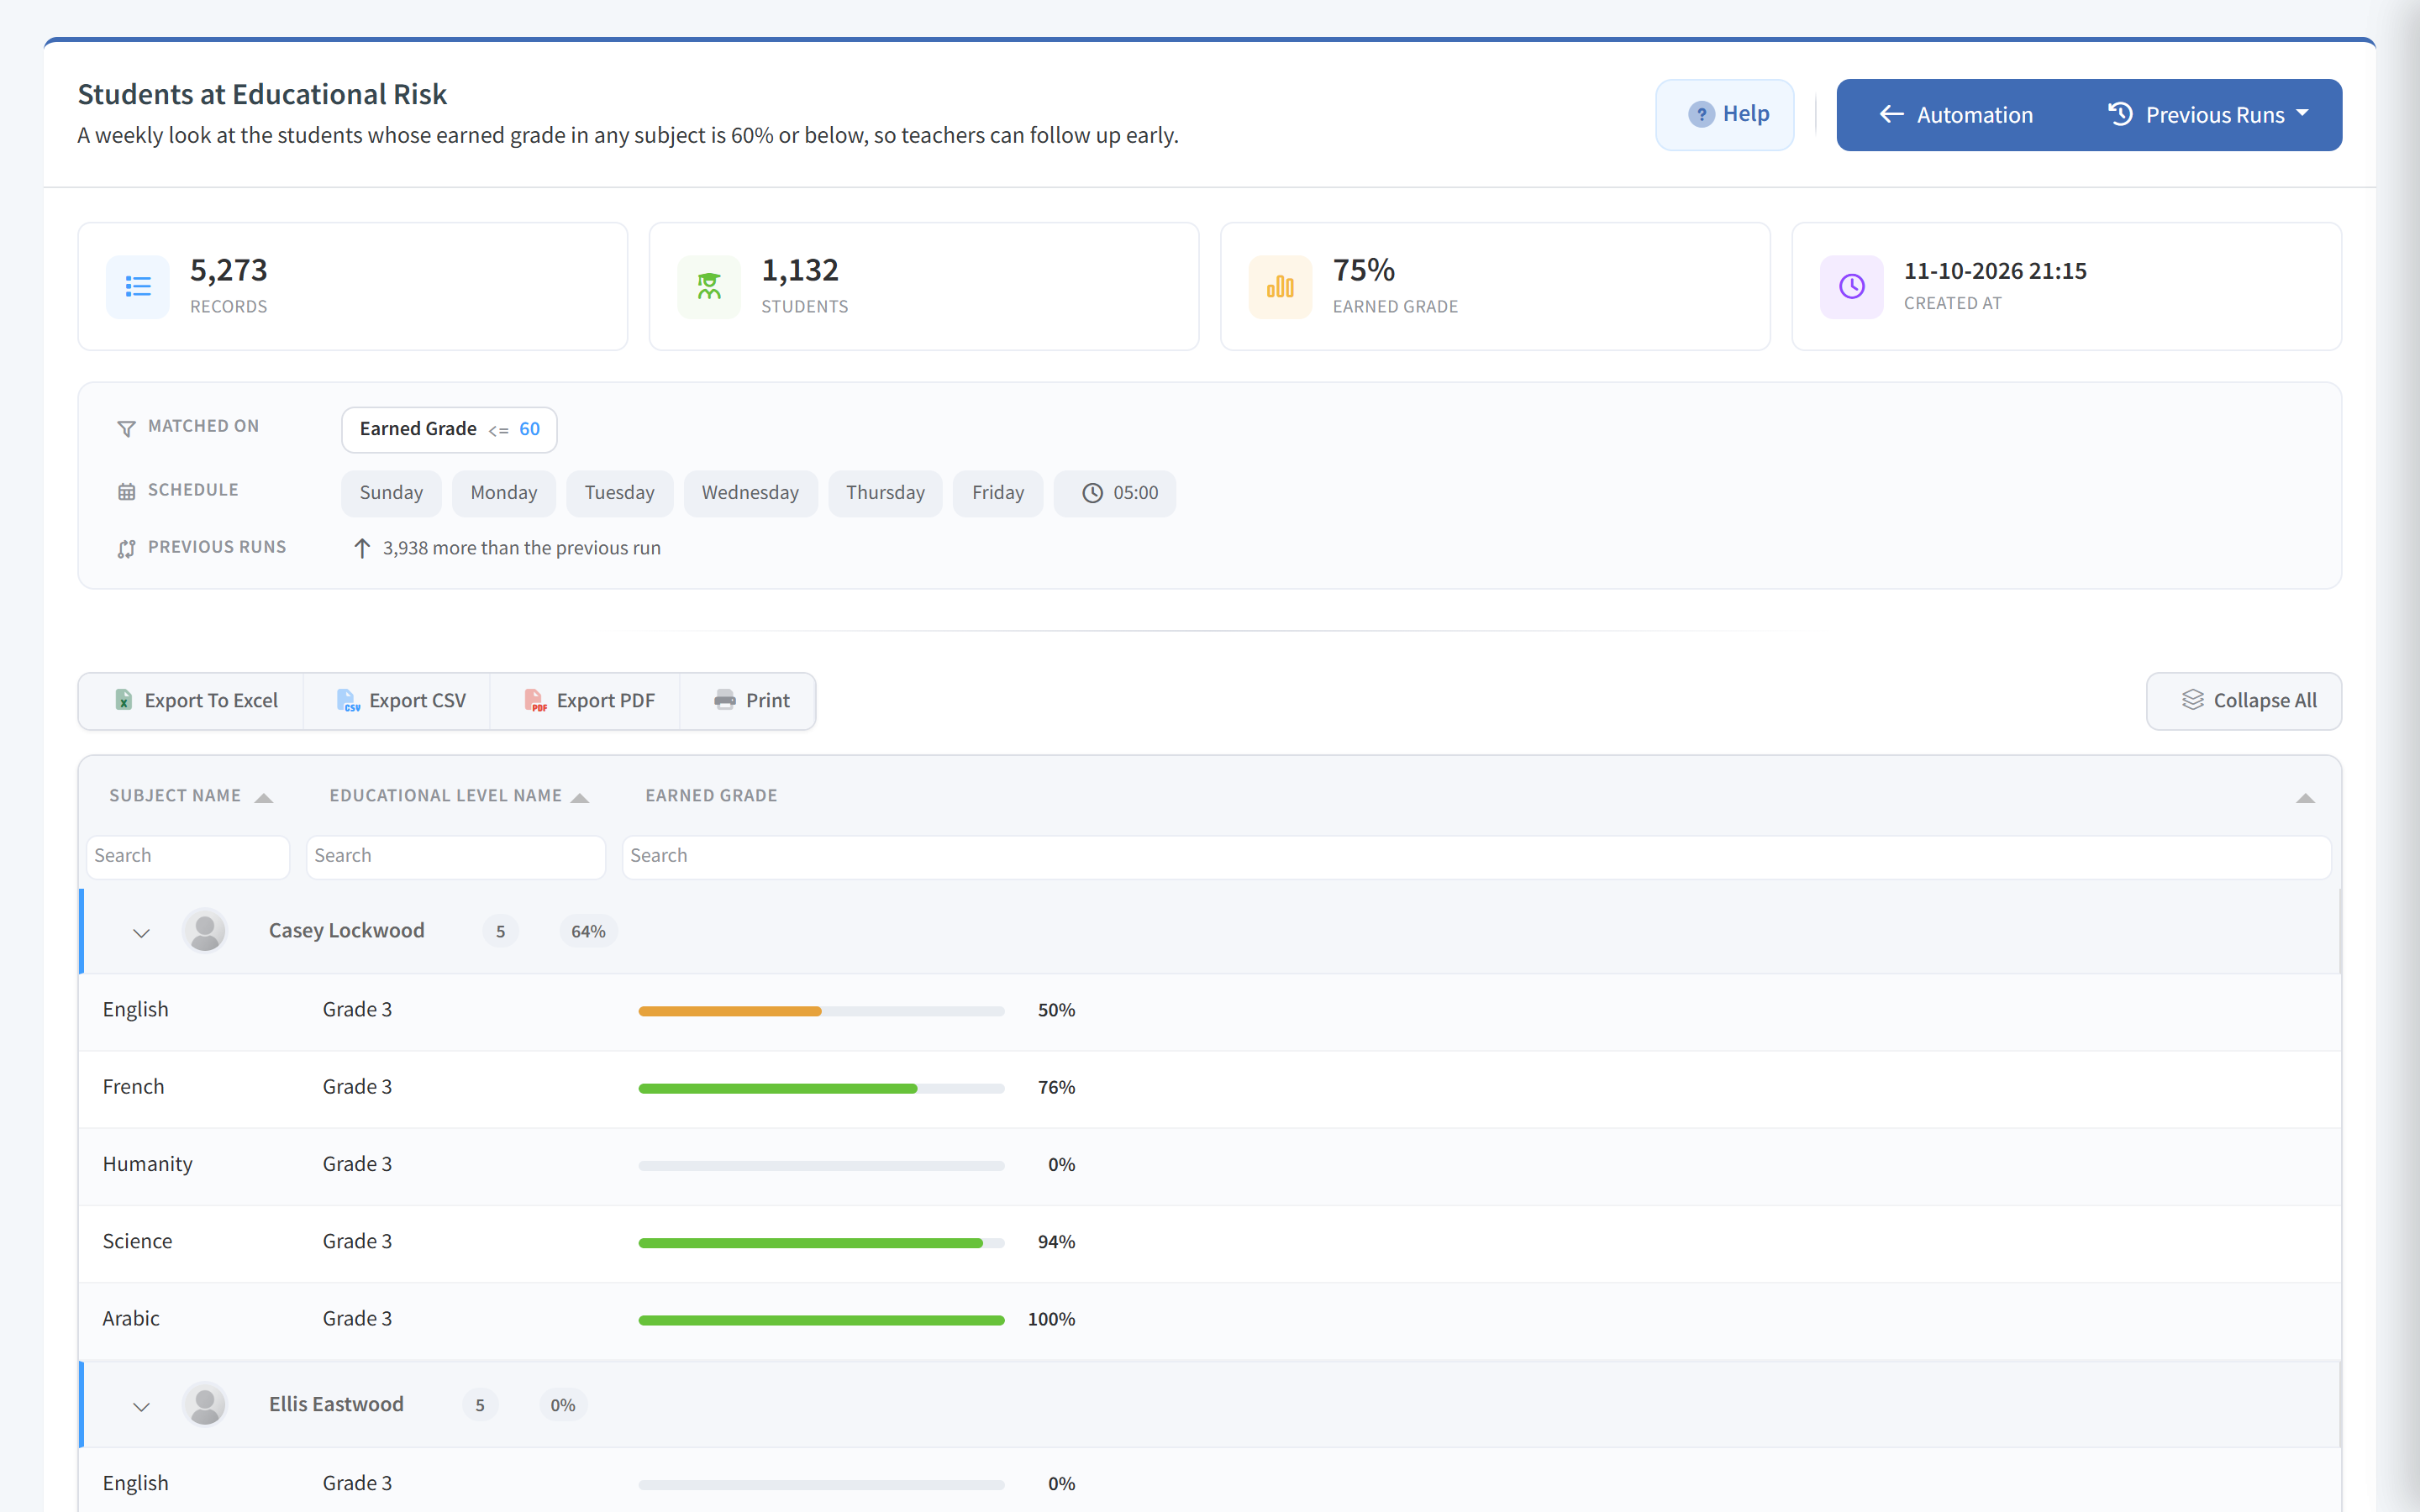
Automation Tasks run a check on your gradebook and assessment data on the days and at the time you choose, such as a weekly look for students whose grades have slipped below a mark you set. Each run notifies the people subscribed, with a link to the results.
For Teachers
Teachers open Reports for their own classes, and Heads of Department also see their department's teachers.
Assignments with students still unmarked, assessment types with nothing published and incomplete skills assessments, before report cards are due.
A score sheet of every student against every assignment of a class, for the dates you pick.
How the class did on each question of an interactive assignment, then each student's points on any one question.
One student's progress in a class by period, assessment type, month or assignment, as charts.
A history of absences, excuses and lateness, and every online session with its start, end and length.
Assignments created and due per teacher, unread messages, message activity and parent meetings across the department.
Form Generator
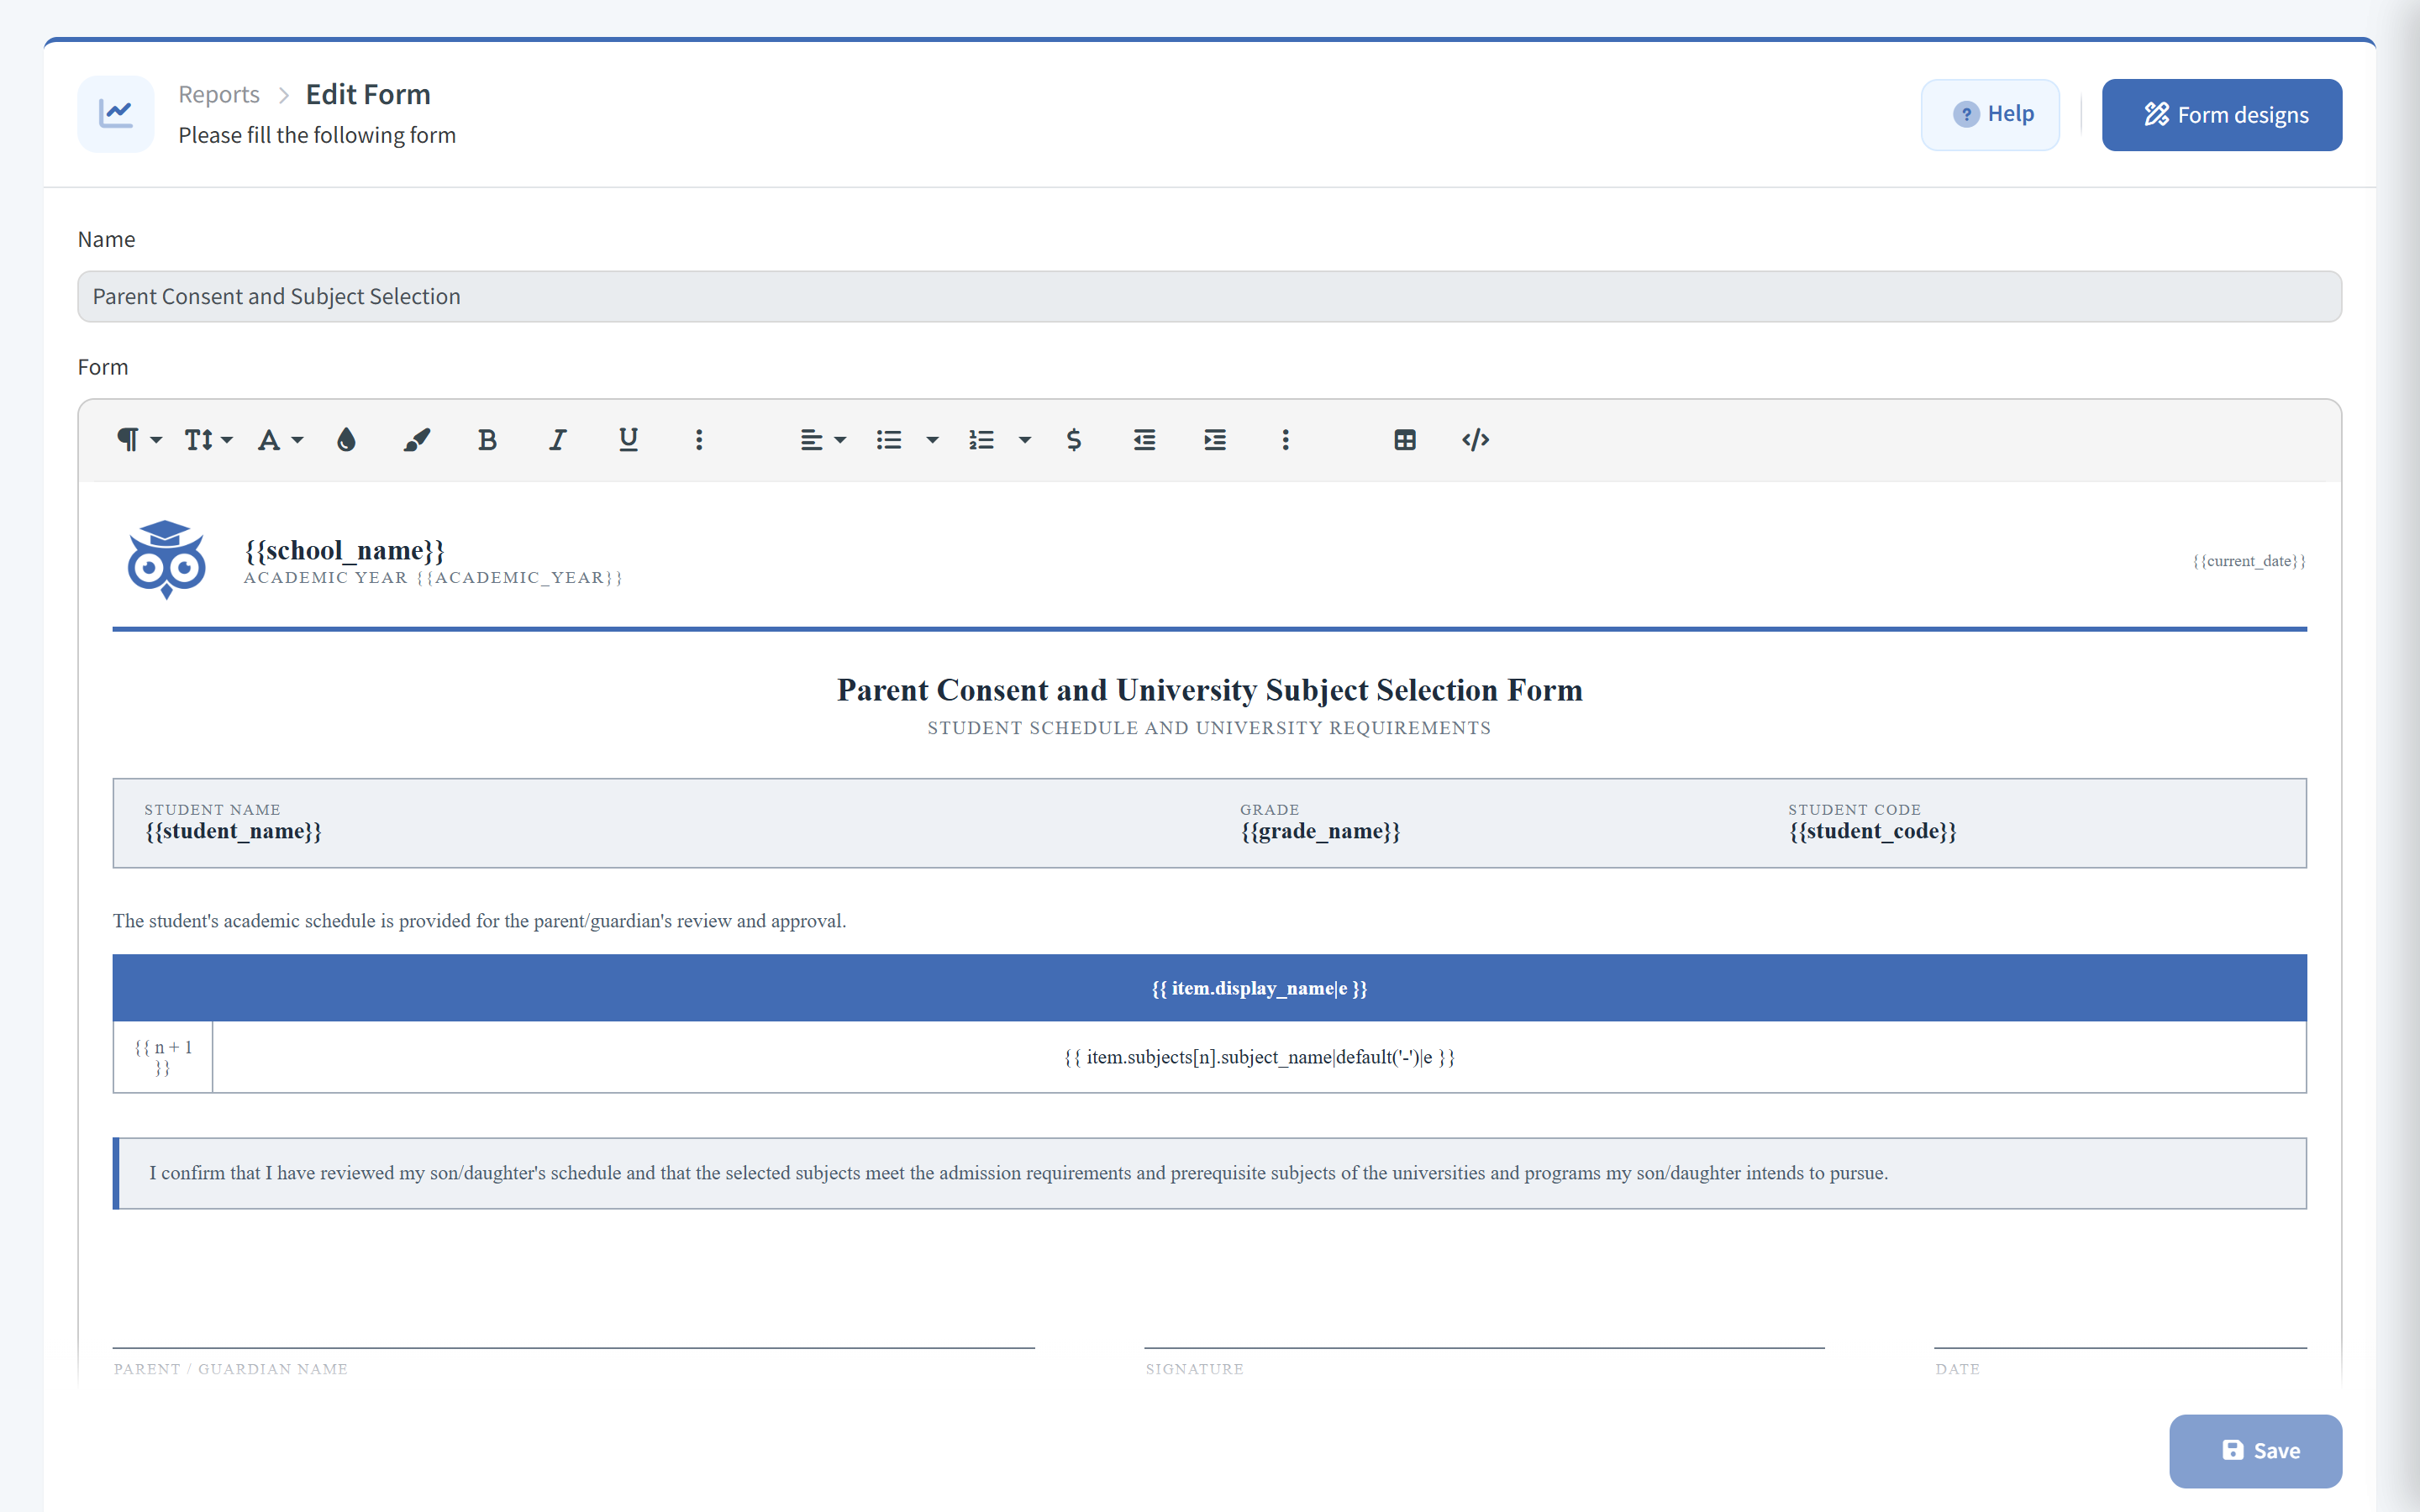
Write a consent letter, a registration slip, a subject selection sheet or an admission test cover page once, with markers where a student's details belong. Form Publisher fills them in for one student, one applicant or whole grades at once.
More than 60 built-in reports across 16 areas, from academics, attendance and admissions to billing, the library, transport, wellbeing and system logs. On top of them come the starter reports and every custom report your school builds.
Yes. Custom Reports takes you through the data source, the columns, the filters, the groups and totals, the sorting and layout, the chart and the sharing, with a live preview at every step. Nothing technical is needed.
Yes. Reports export to Excel, CSV and PDF or print, with your sorting and searches applied, and a custom report's chart downloads as a PNG picture.
Each report shows only what the person running it may see: the reports their group may open, and only the grades it covers. Sharing a custom report decides who may open it, never what data they see.
Automation Tasks run a check on the gradebook and assessment data on the days and at the time you choose, and notify the people subscribed with a link to results they can review, export or print.
Yes. Download a custom report as a small file and import it at the other school after a review. Grades and classrooms travel by name, and who may open it is never copied.
Yes. With SCL Connect, an AI assistant such as Claude or ChatGPT can build a custom report from a sentence, or find and run the right report, acting as the person who signed in and never beyond their role.
Yes. SCL's reports work in Arabic, right to left, as well as in English, and a custom report's title and description can be written in each language SCL supports.
Connected modules
These modules share the same student record, so what happens in one shows in the others.
Families apply online through a form you design, move through admission phases, book an assessment and pay the fee. Accepted applicants enroll in one click.
Daily homeroom and per-subject attendance, excuse types you define, absences enterable for any past date, and automatic notifications to parents.
Merits, demerits, responses and house points in one consistent record that stays on the student profile, with who logged it and how it was resolved.
Set your own grading scales, weight assessment types per subject and score IB criteria in one gradebook, with a live earned grade for every student.